Start with one process you can explain
A chemical engineering portfolio does not need a whole plant. One unit you understand well is enough: a column, a reactor, an absorber or a heat exchanger. Show what it had to do, the decision you made and how you know the result. A reviewer for a process role wants to follow your reasoning from the specification to the number.
This walkthrough uses a fictional ethanol and water column from a final-year design project. The flowsheet is an explanatory diagram and the stream values are teaching figures written for this guide. None of them came from a simulator, a laboratory or a plant.
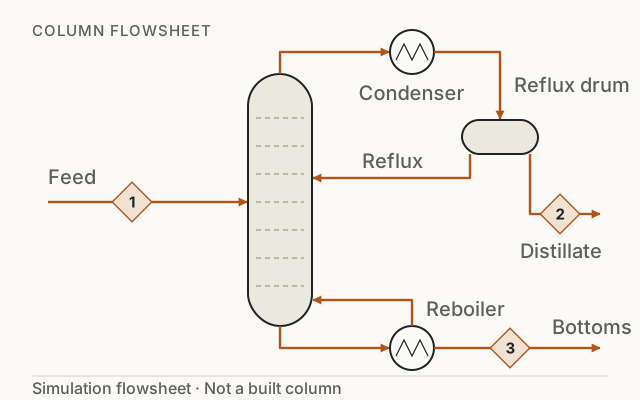
Open the flowsheet at full size.
The stream numbers on the flowsheet match the rows of the stream table below. That link is what lets a reader check your balance.
Write the design basis and your role
The design basis is everything that was fixed before you started. In this example the group brief sets the feed and the purity the next unit can accept. The portfolio author owns the column. A teammate owns the fermenter upstream, so the feed composition is an input the author was given.
That gives the project an honest starting point:
Our group designed a process to recover ethanol from a dilute fermentation stream. I designed the distillation column. The brief fixed a feed of 1,000 kg/h at 10% ethanol by mass and asked for a distillate of at least 90%. The feed composition came from my teammate's fermenter section.
For your own project, state the basis in the units you worked in and say who set each value. If part of the basis was your own assumption, say so. Leave out sponsor names, plant data and anything you do not have permission to publish.
Take the reader from the basis to the result
A flowsheet shows where the streams go. The basis and the limits tell the reader how far to trust the numbers.
Give the feed, the product specification and who set them.
Name the variable you changed and what it cost elsewhere in the process.
Report the figure with its units, and whether it was simulated or measured.
Follow the flowsheet with one decision. In this example the author chooses a reflux ratio. A higher ratio needs fewer stages but more reboiler duty, so the choice costs energy somewhere else. Explain the variable you changed, the range you tried and why you stopped where you did.
Name the method as well as the tool. "Aspen Plus" tells the reader little. "A rigorous column model with an activity coefficient method, checked against a hand McCabe-Thiele construction" tells them how far to trust it. If two methods disagreed, say by how much and which one you used.
Show that the balance closes
A stream table is the quickest evidence that your numbers belong together. Keep it small. Three streams and two components are enough for a portfolio page.
| Stream | Total, kg/h | Ethanol, kg/h | Water, kg/h | Ethanol, % by mass |
|---|---|---|---|---|
| 1 Feed | 1,000.0 | 100.0 | 900.0 | 10.0 |
| 2 Distillate | 106.1 | 95.5 | 10.6 | 90.0 |
| 3 Bottoms | 893.9 | 4.5 | 889.4 | 0.5 |
Teaching values chosen so the balance closes. They are not simulation output or measured data.
Then say what the table shows. The distillate and bottoms add up to the feed: 106.1 + 893.9 = 1,000.0 kg/h. The ethanol adds up too: 95.5 + 4.5 = 100.0 kg/h. That puts 95.5% of the ethanol in the distillate. A reader can check each of those sums in a few seconds, which is the point of including the table.
If your own balance does not close, report the gap and where you think it comes from. A stated 2% closure error with a reason is more useful to a reviewer than a table that has been adjusted to look exact.
Separate a prediction from a measurement
"90% ethanol in the distillate" could be a specification, a simulation result or a laboratory reading. Those are different claims, and a process engineer will ask which one you mean.
| Claim | What to state beside it |
|---|---|
| Specification | Who set it and why the next unit needs it |
| Simulation result | The model, the main assumptions and what you varied |
| Laboratory or pilot reading | The rig, the method, the number of repeats and the spread |
| Estimate | The correlation or rule of thumb and its usual range |
In the fictional project, the student's figures would all be simulation predictions. The sample entry below says so, and names tray efficiency as an assumption nobody tested. A model gives theoretical stages; the number of real trays depends on that efficiency. No column was built. A portfolio entry that admits this reads as careful work.
A completed portfolio entry
Here is sample copy for the fictional project, written as the student would write it:
I designed the distillation column for a group project recovering ethanol from a fermentation stream. The brief fixed the feed and a 90% distillate. I built the column model, checked the stage count against a hand construction and tested how the reboiler duty changed with reflux ratio. The stream table shows the balance I designed to. Every figure is a simulation prediction, and the tray efficiency I used to turn theoretical stages into real trays is an assumption I did not test. The next step would be to compare the model with published tray data for a similar column.
For a real project, replace the pending work with what you observed. Keep units with every value, and keep the limit beside the result instead of in a separate section the reader may not reach.
Add a safety or laboratory project
A second project can show a different skill. A HAZOP exercise shows that you can read a P&ID and reason about deviations. A laboratory study shows that you can plan runs and report uncertainty. For either one, the same structure applies: what was fixed, what you did, and what the evidence does and does not show.
For a HAZOP entry, show one node, the guidewords you applied and an action you raised. Say that it was a coursework exercise on a teaching drawing if it was. For a laboratory entry, show the trend with the spread of your repeats and name the limit of the rig.
Choose what to publish
Before sharing a project, check that:
- The reader can tell which unit or calculation is yours.
- The flowsheet is readable and its stream numbers match your table.
- Every figure has units and says whether it was specified, simulated or measured.
- The balance closes, or the gap is stated.
- The shared files contain only material you are allowed to publish.
- Your project or report link opens the intended public resource.
The chemical engineering portfolio guide explains how this project fits into a full portfolio. The Process template shows the layout with fictional sample content, and draws a flowsheet of your projects from their titles. The template does not check the engineering. If an application asks for a PDF, prepare that separately; FolioBuild publishes a website.